FDIC Report Highlights the Continued Outsized Growth in NDFI and Securities Lending
Sensing a theme?

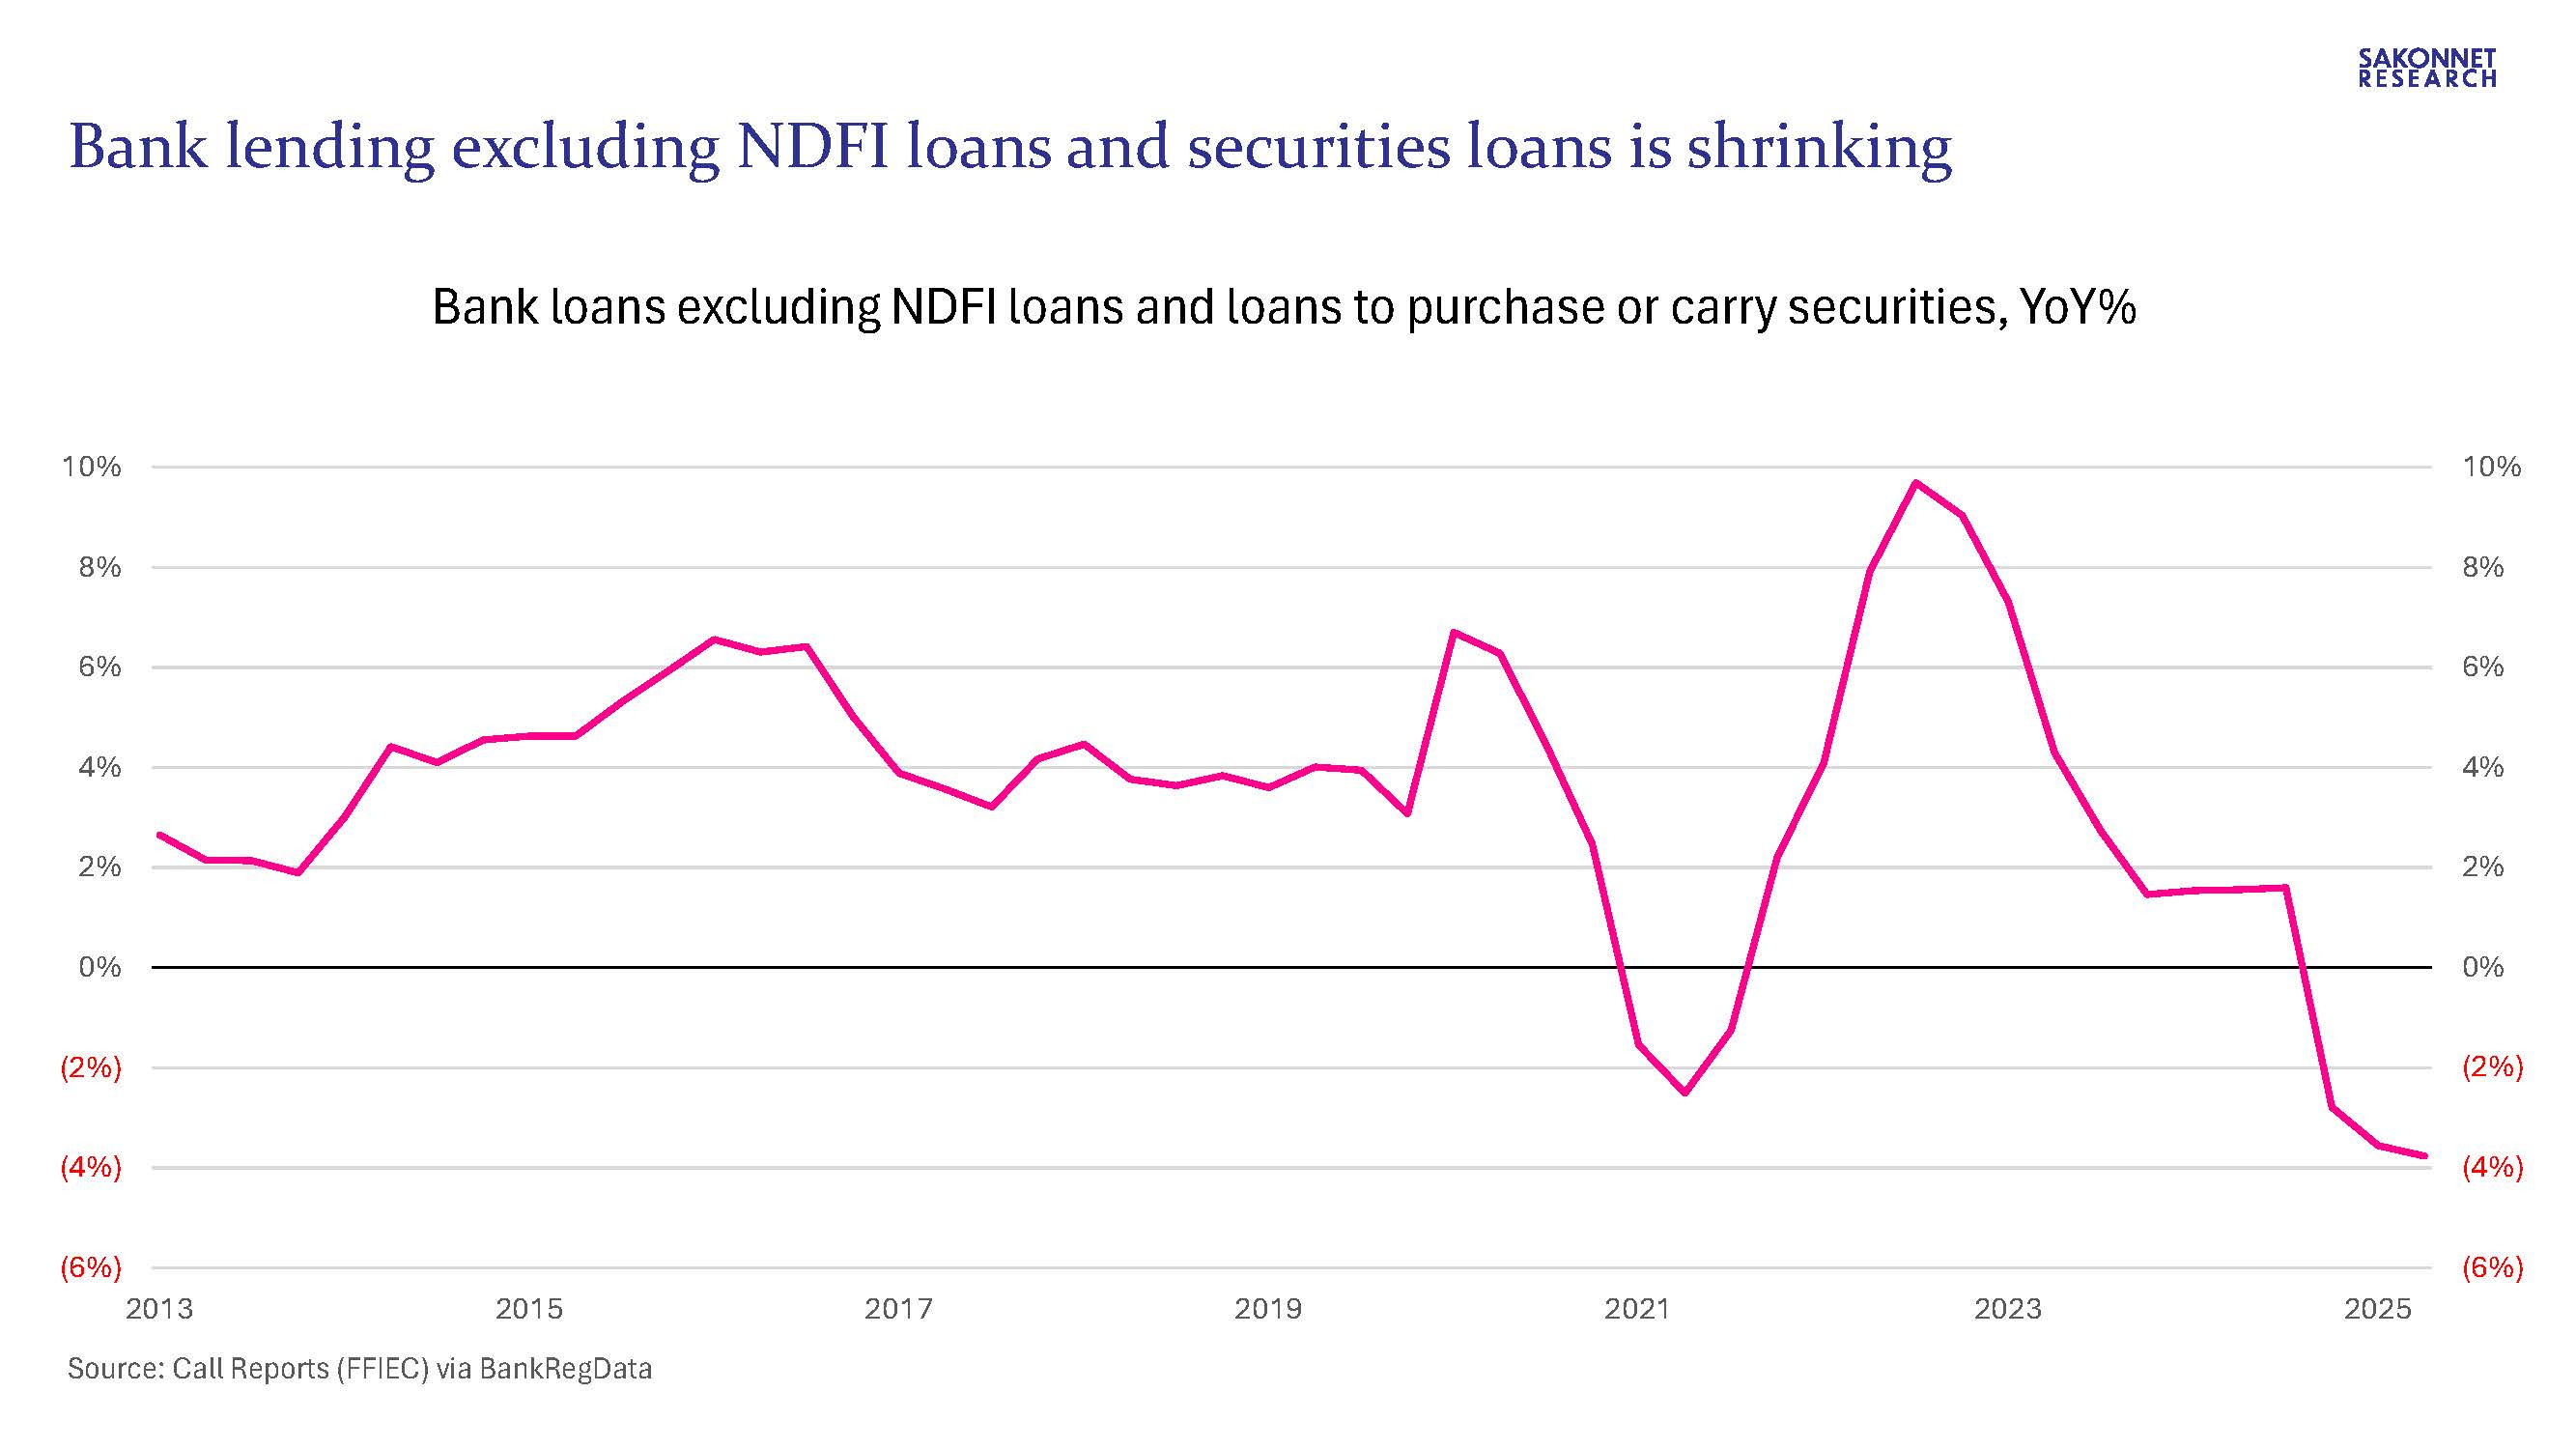
I wrote last week about mushrooming bank lending to nondepository financial institutions (NDFIs) and its impact on the financial economy/asset markets (link). Along those lines, the FDIC published its 2Q25 Quarterly Banking Profile earlier today, which pointed out that the fastest loan growth is coming from loans to NDFIs and loans to purchase or carry securities, including margin loans. Part of the growth in these categories is coming from the reclassification of other loans, which has been happening since 2Q24; it’s unclear how much of the NDFI and securities loan growth since then has been “underlying” vs. reclassifications. The chart below is therefore skewed by the reclassification effect, but the trend toward securities-based loans is nonetheless very real.
Even before the reclassifications began, bank loan growth excluding these two securities-based categories (meaning to the real economy) had stalled: it averaged 1.5% in 4Q23/1Q24, well below the 2013-2022 growth rate of 4.1% and well below the rate of inflation/CPI. There’s been a dramatic divergence between the health of the financial economy (asset prices are at record highs in many cases) and that of the real economy (link), and banks’ lending behavior—and that of their affiliated broker-dealers—has been a contributing factor.
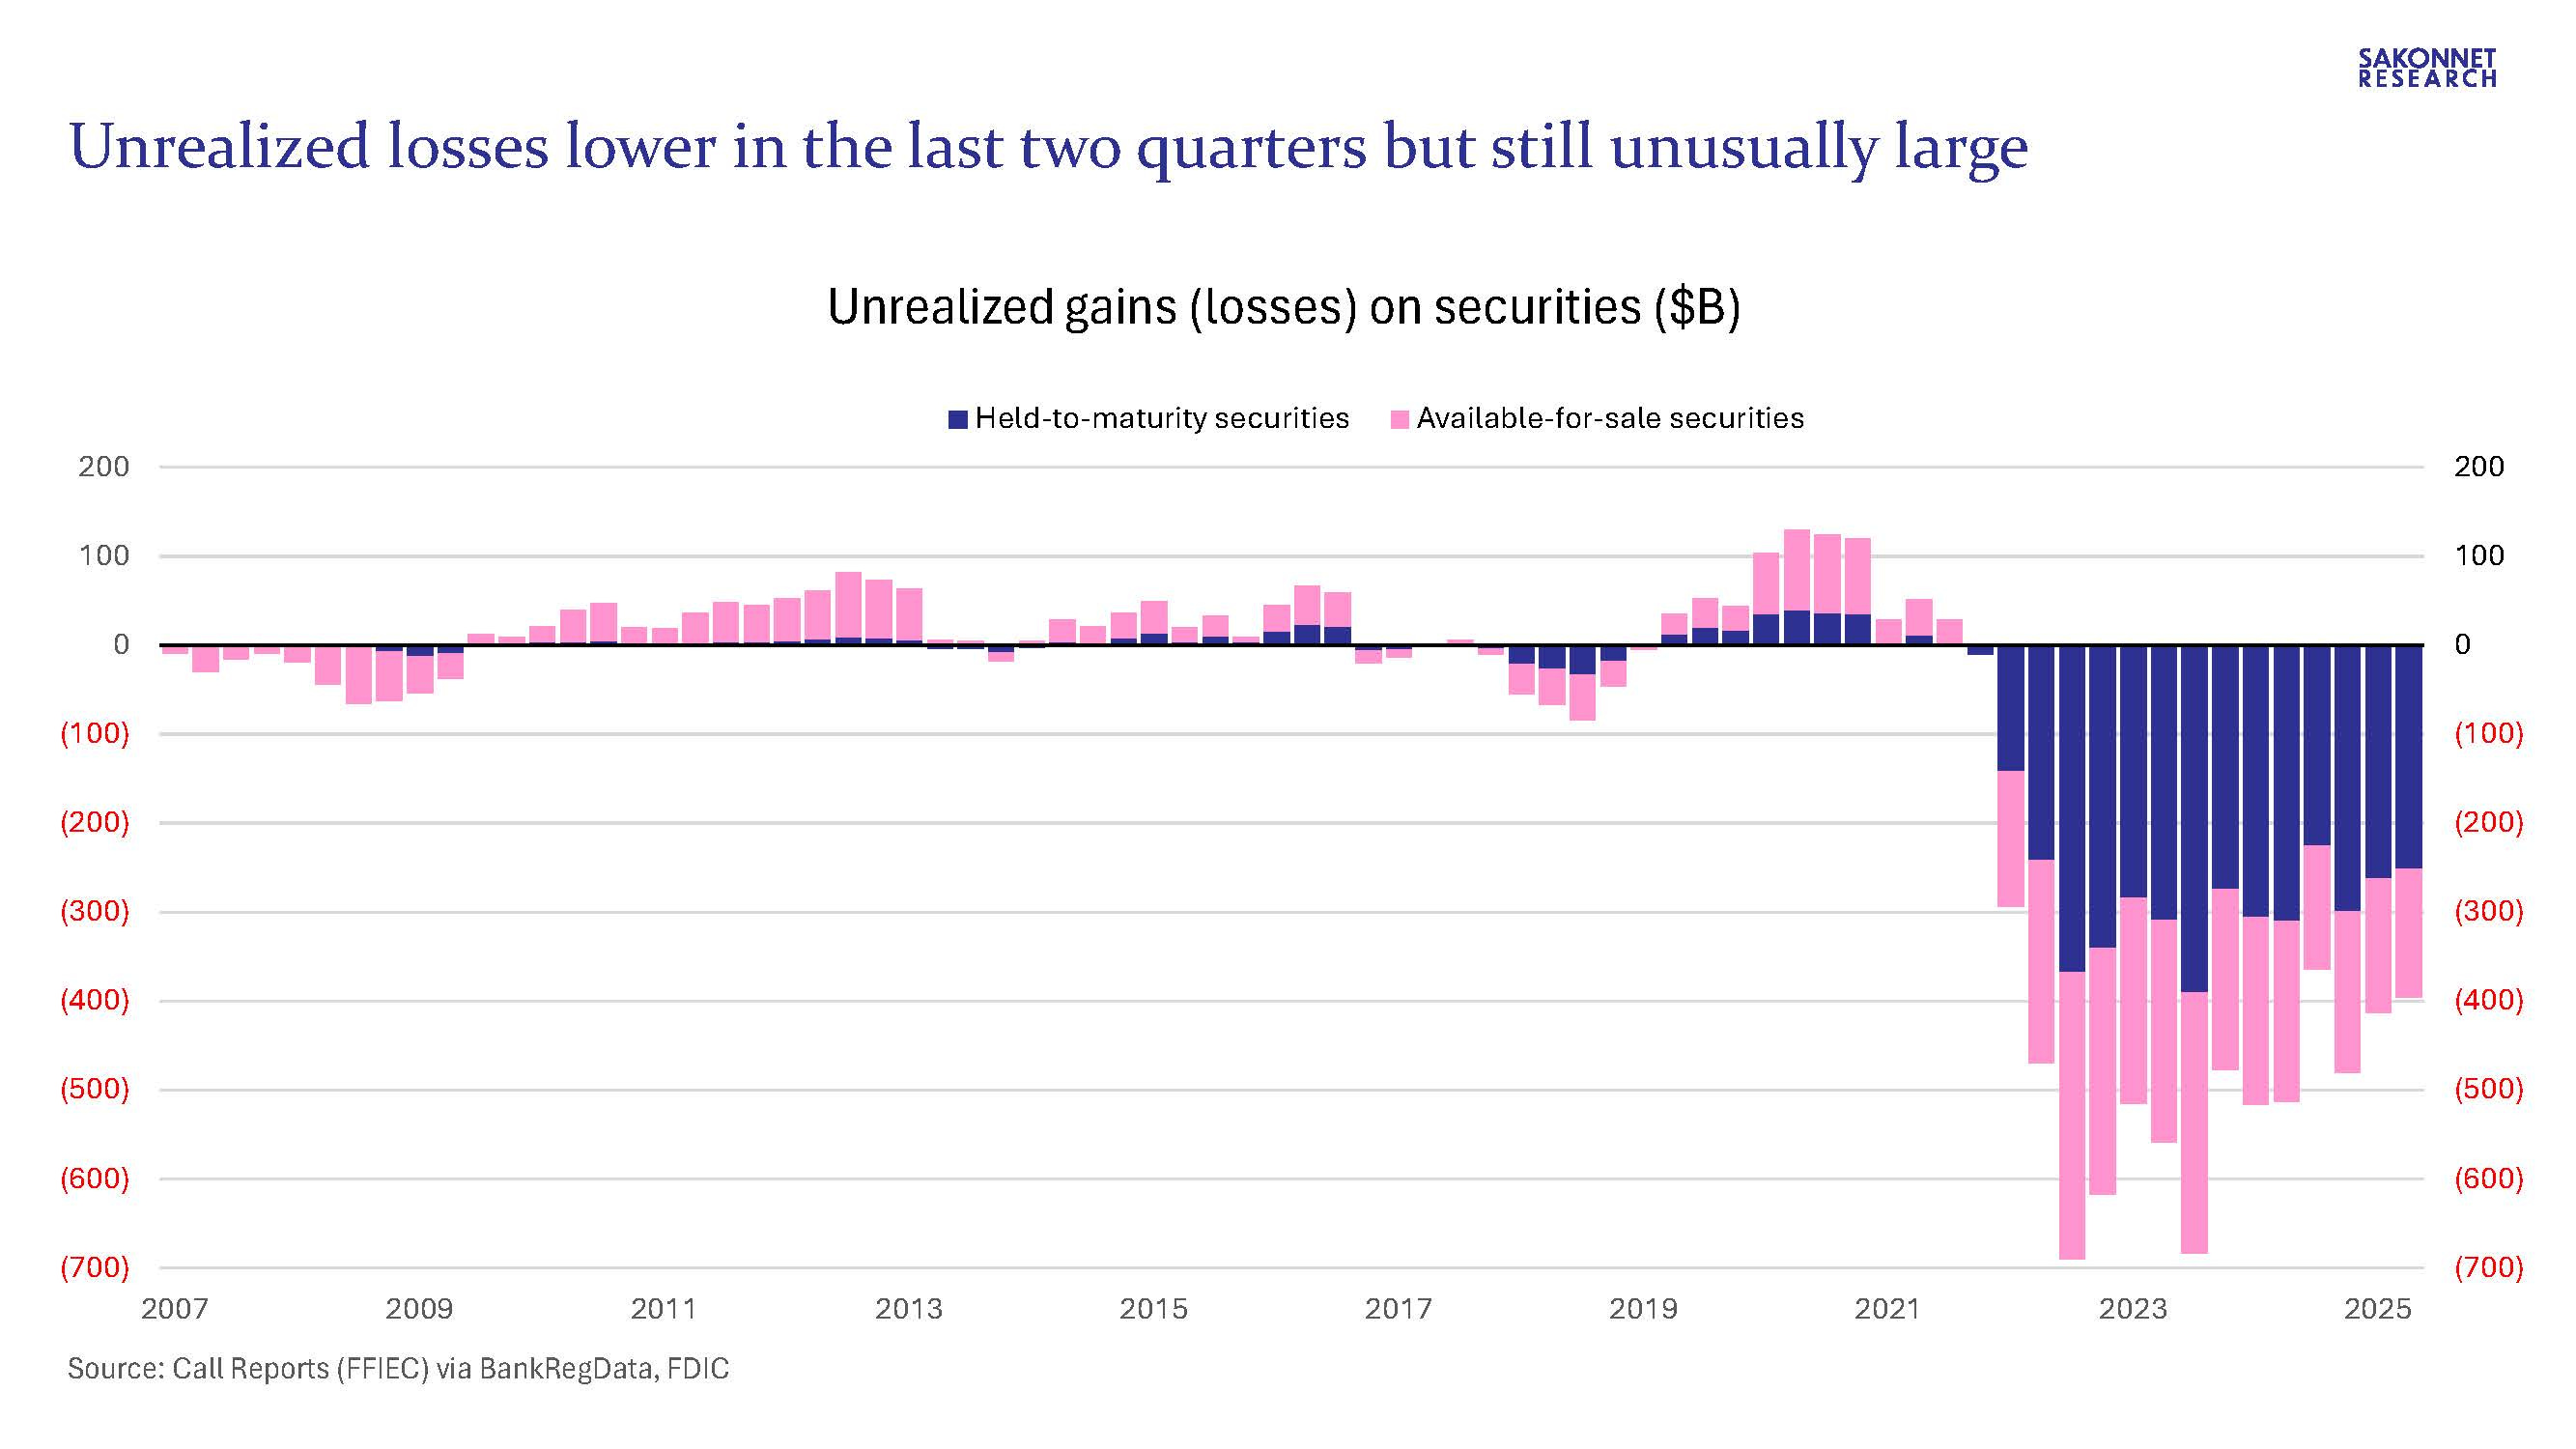
The FDIC’s report also highlighted the large unrealized losses on securities that banks are still sitting on: $395.3 billion in 2Q25, down sequentially and vs. a year ago but still dramatically higher than pre-2022 levels. For some perspective, banks’ tier 1 capital in 2Q25 was $2.27 trillion. Tax-effected unrealized losses—using a 21% tax rate and stripping out the unrealized gains on AFS securities flowing through AOCI—represented a substantial 13% of tier 1 capital, such that tier 1 capital after adjusting for these tax-effected losses is only 6% higher than the comparable figure five years ago per my calculations.
These sizable unrealized losses highlight banks’ sensitivity to fluctuations in long-term interest rates, which are sensitive to the problematic supply-demand dynamics affecting the U.S. Treasury market (lots of Treasury issuance coming given yawning budget deficits, and slowly declining demand for Treasurys among price-insensitive buyers including the Fed and foreign central banks).
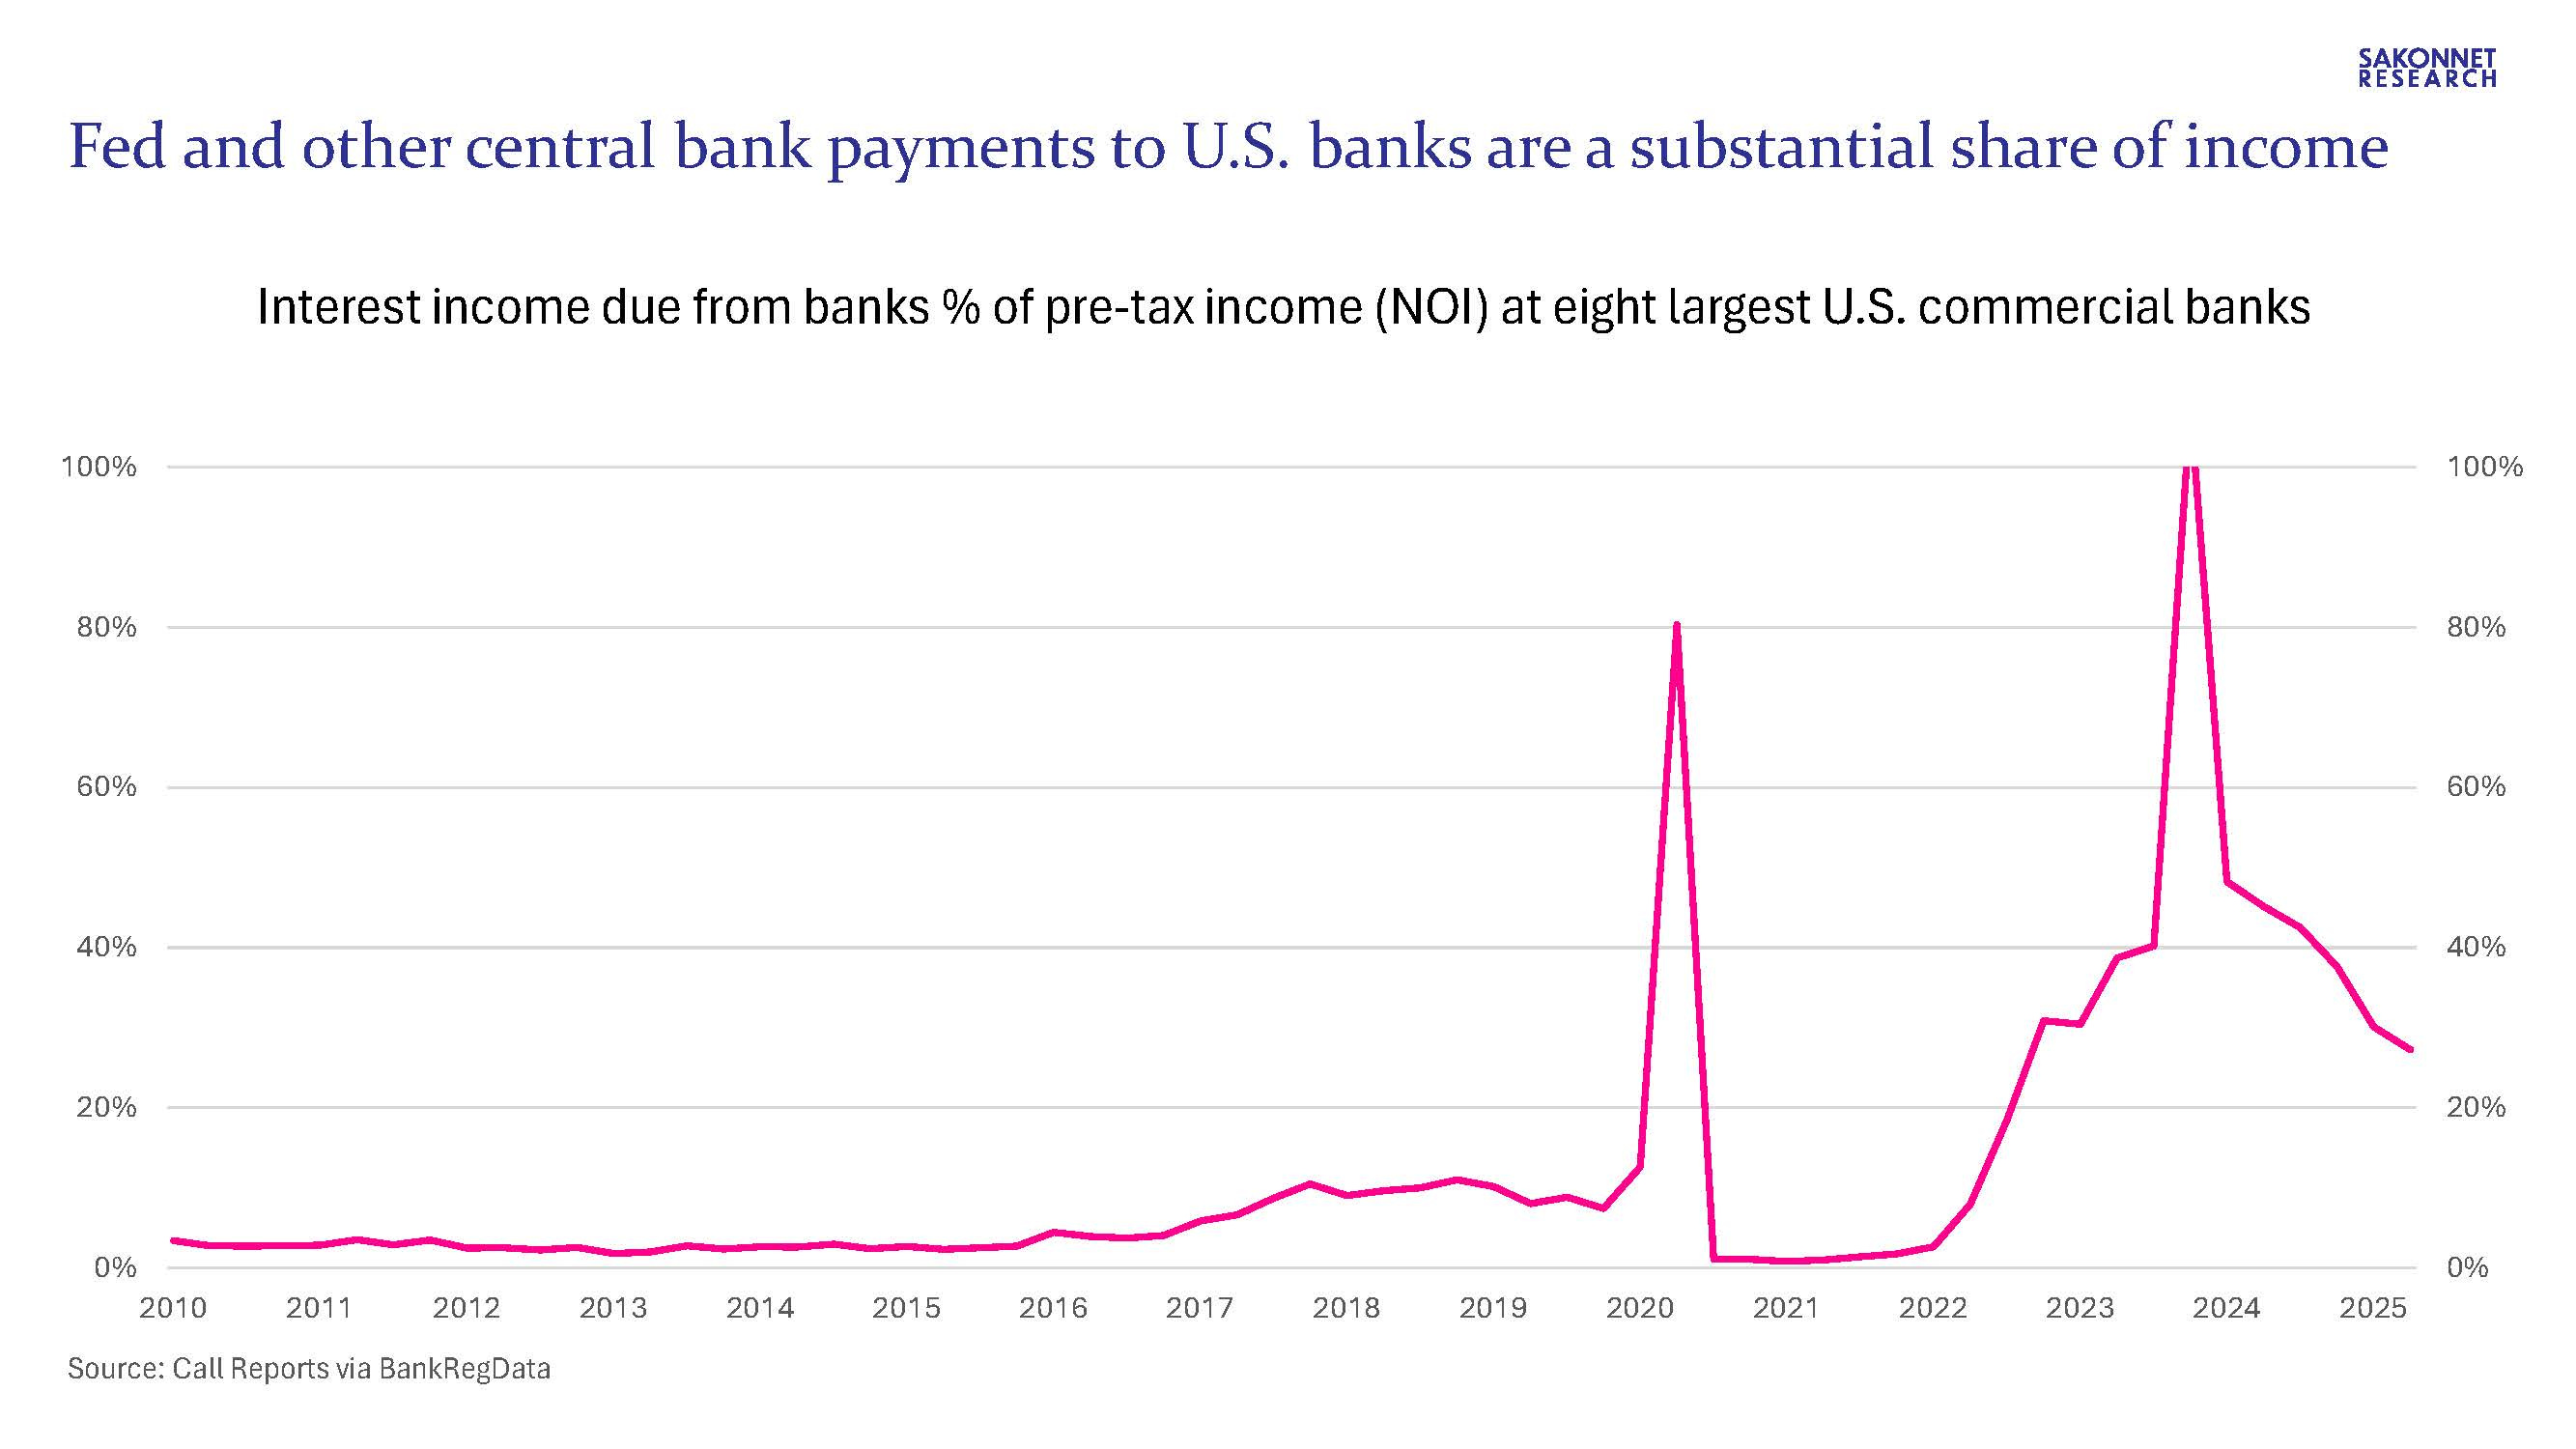
Which brings me to my last chart, a topic that the FDIC didn’t cover: the Fed and other central banks’ ongoing interest on reserve balances (IORB) payments to banks, a previously arcane topic that has been given more prominence owing to some government officials’ desire to reduce the huge deficit (link). As I wrote a few weeks ago, these payments accounted for an eye-opening 30% of the eight largest U.S. commercial banks’ pre-tax income in 1Q25, and a much higher percentage in previous quarters. In 2Q25, they were a still-substantial 27%. (I’m not taking into account any cost of funds associated with the money that banks are parking at the Fed and other central banks, because it’s unclear what that cost is, if any. Banks have $5.5 trillion of non-interest-bearing deposits, nearly 30% of total deposits.) The Fed’s largesse has been very helpful indeed to banks.