The Ongoing Disconnect Between GDP Growth and Consumer Companies' Results
Government and health care spending continues to drive GDP growth
I’ve written at length about the disconnect between above-trend U.S. GDP growth and sales weakness among a wide variety of consumer companies, particularly given that consumer spending accounts for nearly 70% of GDP. That disconnect was once again evident in the 3Q GDP data: real GDP increased at an annual rate of 2.8% following 3.0% growth in 2Q, while an unusually large number of consumer companies have been cutting their full-year sales guidance over the past three months. As Walter Mondale once said, “If you are sure you understand everything that is going on, you are hopelessly confused.”
Perhaps there’s a way to at least partly understand what’s going on, courtesy of the Bureau of Economic Analysis (BEA). The BEA noted that 3Q GDP growth primarily reflected increases in consumer spending, exports, and federal government spending. Regarding the latter, government spending accounted for an unusually high 30% of GDP growth in 3Q and 23% over the past two years, compared to the pre-COVID (1985-1Q20) average of 14%. And of the increase in consumer spending, the leading contributors were nondurable goods (led by prescription drugs) and health care, which highlights the increasingly prominent role that health care spending has played post-COVID. Health care services spending has accounted for 22% of GDP growth over the past two years, double the pre-COVID average. And regarding prescription drug spending, it accounts for the vast majority of a spending category called “Pharmaceutical and other medical products,” which accounted for 12% of personal consumption expenditures/consumer spending growth in 3Q and 10% over the past two years, compared to the pre-COVID average of 4%.
What’s happening, in other words, is that government spending is accounting for an ever-larger share of GDP growth, as is spending on the most essential of items (prescription drugs and health care services).
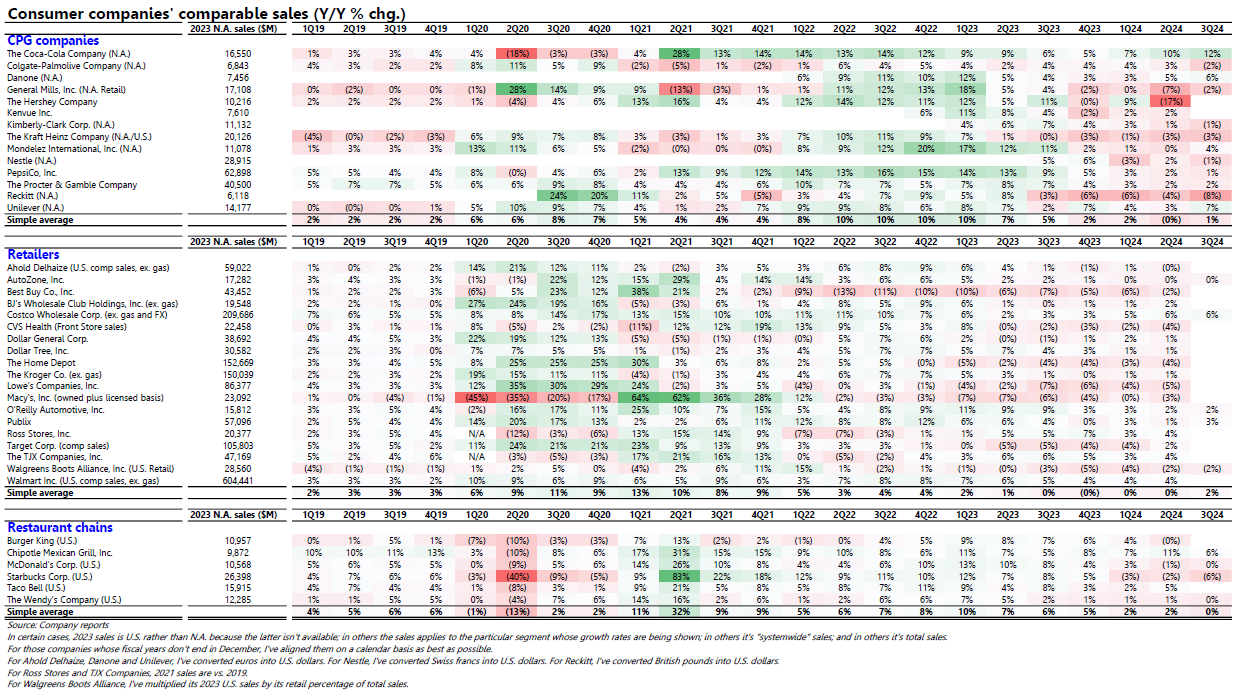
It’s little surprise, then, that consumer companies that sell items other than prescription drugs and health care services are experiencing weak sales trends with few exceptions. In the table below, I show the comparable sales trends (otherwise known as same-store or organic sales) of many of the largest consumer companies in the U.S., grouped into consumer packaged goods (CPG) companies, retailers, and restaurant chains. Among retailers, I’ve tried to exclude sales related to prescription drugs to the extent possible, to see what Americans are spending on other items. What’s clear is that comparable sales growth has slowed to virtually nil in the last two quarters, reflective of an environment in which many Americans have had to limit or eliminate their spending on discretionary items as the cumulative effects of inflation have become readily apparent.
What’s far less clear is when or why this state of affairs will change. The Federal Reserve can continue to cut the federal funds rate, but as we’ve seen since the Fed cut by 50 basis points in late September, the Fed has little to no control over the borrowing rates that affect most households. In fact, those rates have gone up considerably since the Fed cut; witness what’s happened to the 30-year fixed mortgage rate.


